Data Lens
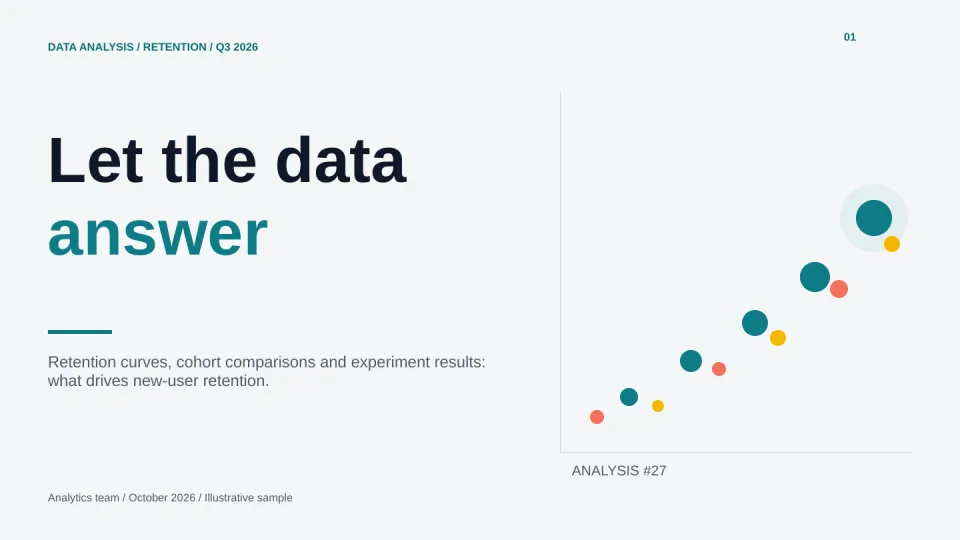
Teal data, scatter dots and metric tiles for analysis reports.
For data analysts: analysis reports, metric reviews and experiment results.
 Loading preview…
How to use this template
State the question before the answer. Label units, sample sizes and definitions, separate correlation from causation, and end with what the team should do next.
When to consider another layout
Built for findings and evidence; dense dashboards with many charts are better shared as a linked report.
A starting prompt
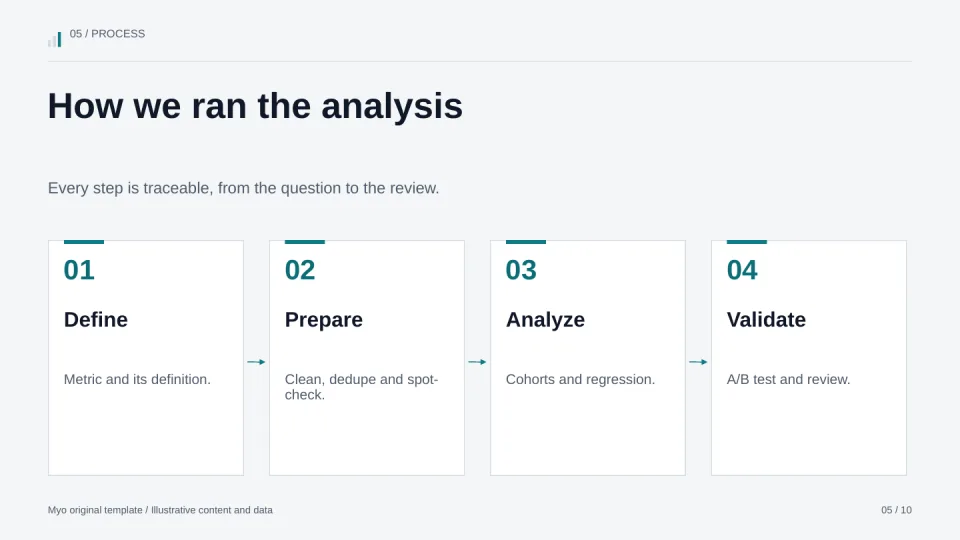
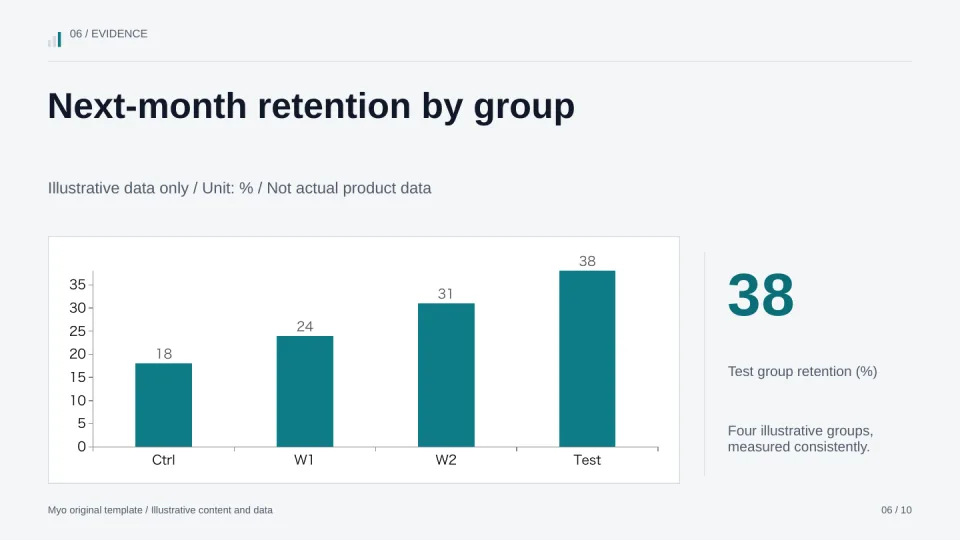
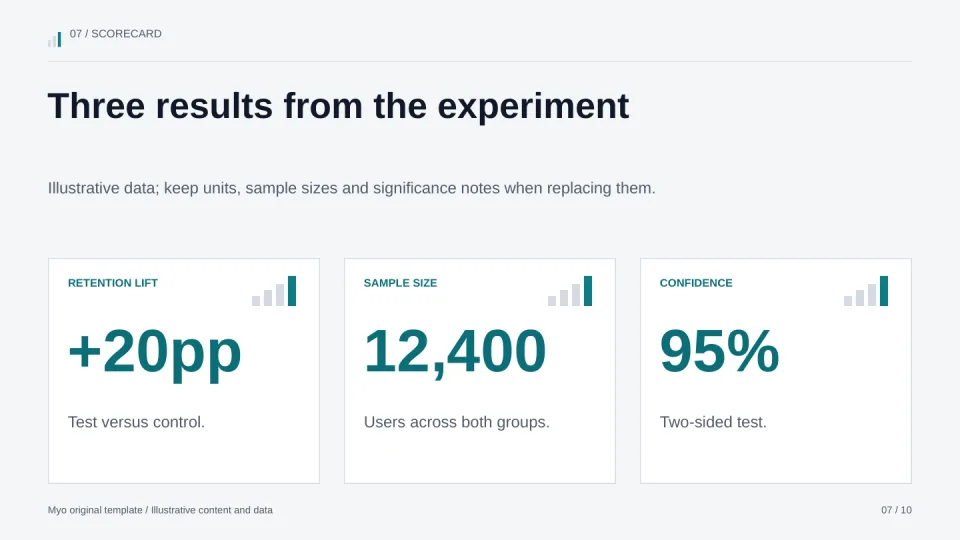
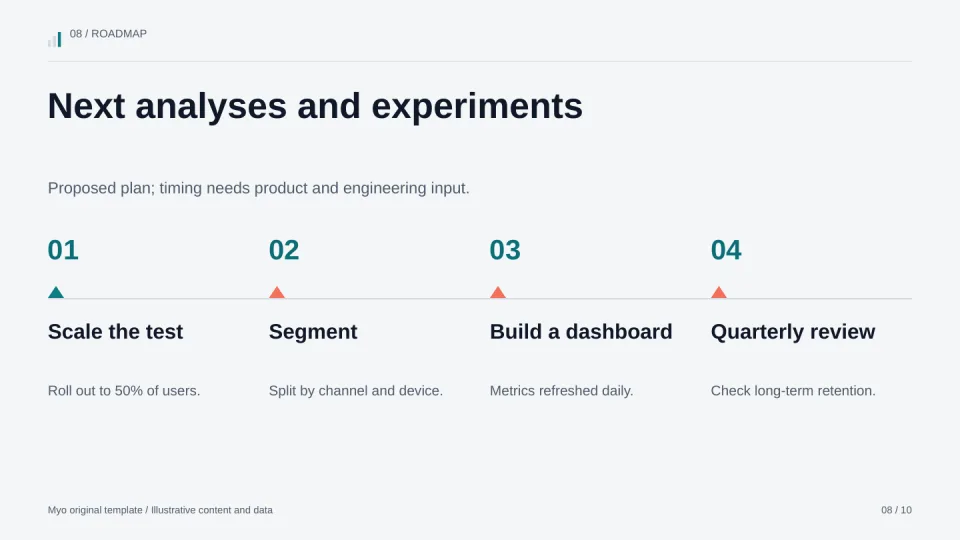
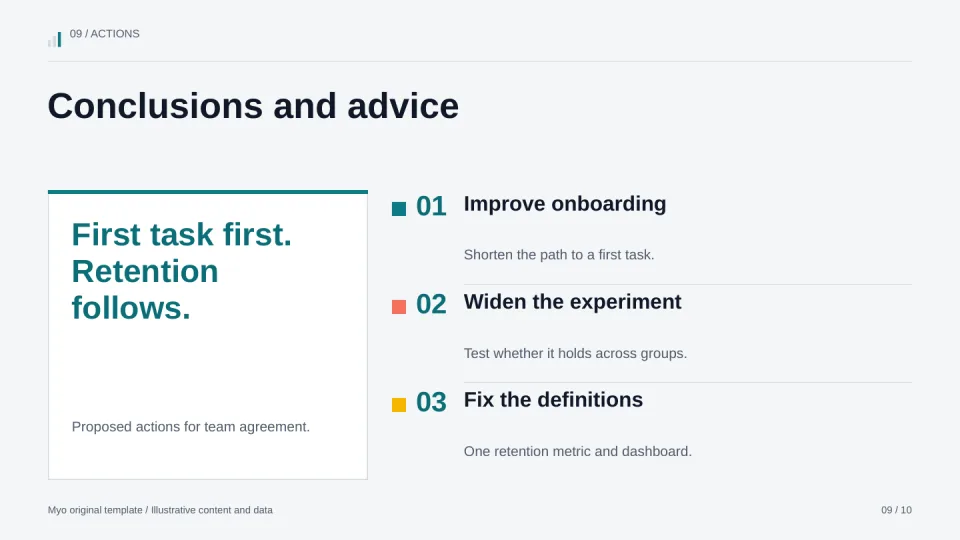
Prepare an analysis report: the question, key finding, cohort comparison, method, retention data, experiment results, next analyses and recommendations. Do not invent data or significance.
Adapt this example with your own facts and numbers before generating.
10 layout previews
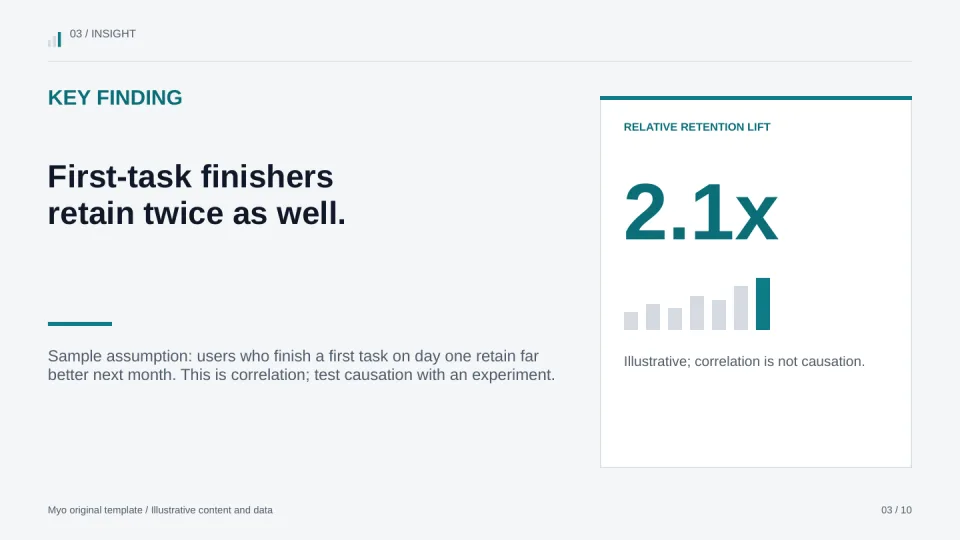
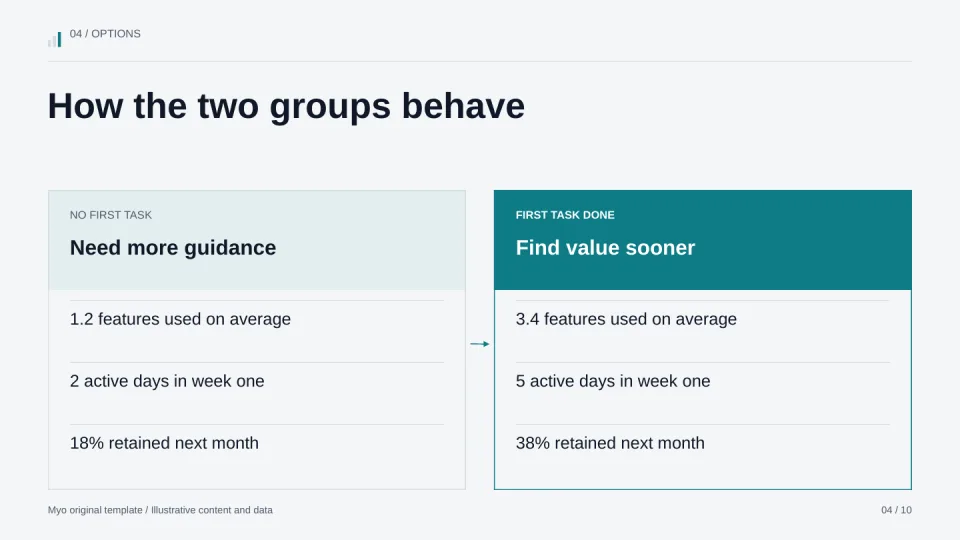
These English samples show real editable layouts. All sample text and numbers are illustrative. Choose your slide language when generating.
Loading preview…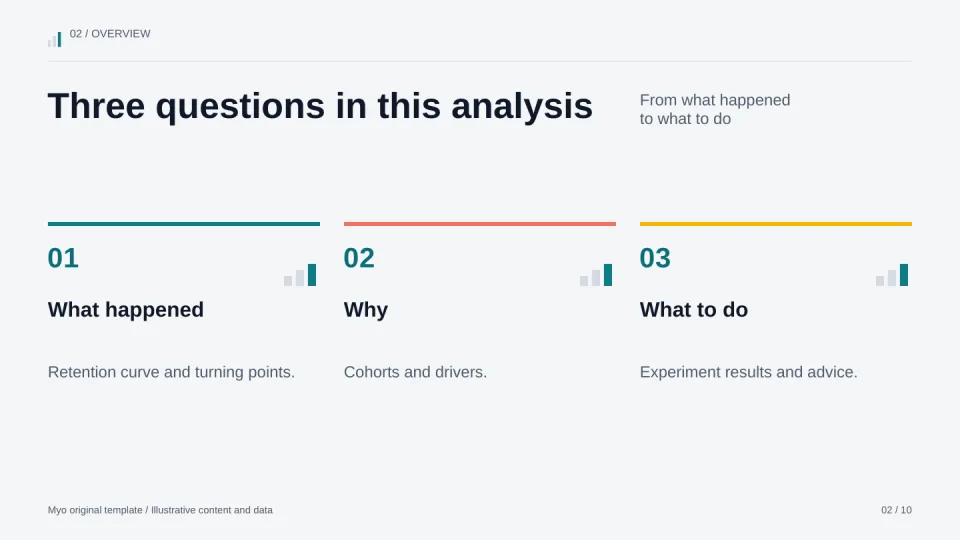 Loading preview…
 Loading preview…
 Loading preview…
 Loading preview…
 Loading preview…
 Loading preview…
 Loading preview…
 Loading preview…
 Loading preview…